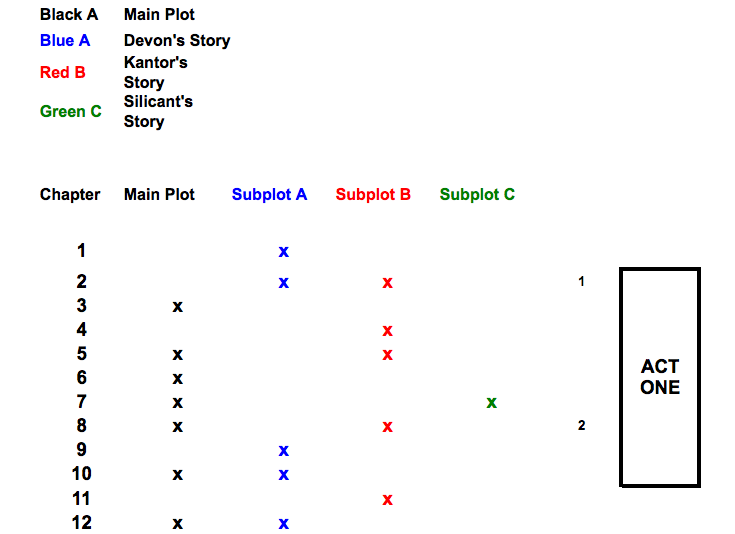
One aspect of my spreadsheet outline that does not help me much is visualizing subplots. I needed a thumbnail view or big-picture view of all the subplots in Starforgers. My solution was to create a sheet that only showed when I mentioned each subplot on a per chapter basis.
So I have Chapter in the first column, then the Main Plot, followed by Subplot A, B and C. I put an “x” in each cell where the subplot is used in each Chapter. This produces a good overview of all the subplots. I also added where Act One, Two and Three start and stop, so I can see the relationship to the overall story arch each chapter and subplot are a part of.
Here’s what the sheet looks like:
It’s nothing fancy, but it lets me see how much time I’m spending on each subplot. Every writer has his or her own tricks for keeping track of this kind of thing. Some folks use fancy writer programs, some use a spreadsheet. I’ve tried the fancy writing programs but usually they wind up being more work than what I need. Keeping track via one spreadsheet book with multiple sheets is the best way for me, personally.
Starforgers is the most complex novel I’ve written to date. There are three major subplots and each is overlapping the other in the larger, main plot. It’s very hard to keep all these tracks clear in your head while writing and a chart like this lets you see when you start to go astray.
I’m heading into the second half of the Act Two and all these subplots are going to start merging as the Climax approaches. I’ll be switching more frequently from subplot to subplot within single chapters. There is no magic formula for when to switch, just as long as the reader does not get confused. When my Alpha Readers start reading Starforgers, they will tell me when they get confused and I can use this chart to see where I might need to come back to a certain subplot and clear up any confusion.
